DRM-Log Plotter Web Help How To . . . (for Dream Logs)
THE DRM-LOG PLOTTER MAIN WINDOW

WRITE YOUR PREFERENCES
Click in the plotting area. The following Set-up window opens:
Set up these three items first:
- Your Site Latitude and Longitude (necessary to calculate Distance and Azimuth to the Transmitter)
- Decide on a Nickname (to give your log files a more personal look)
- Write a Profile (i.e. your receiver and type of antenna)

In the Basic Setup Parameters you can:
- Choose between a black (default) or white plot background.
- Choose between showing the distance to the transmitter either in kilometers (default) or miles.
- Decide whether you want alerts (default) when you make a screenshot or not.
(The warning when attempting to overwrite a screenshot will always be active). - Decide whether you want alerts (default) when there are more than one Transmitter Site to choose from or not.
- Decide whether you want to plot the audio as you are used
to from previous versions of the DRM Plotter ("Classic", default) or if
you want to expand the height to twice as large. (The "Double" is only
active in "Plot Dream Log Files")
- The Option "Plot Audio and Decoded Audio" is only possible
to select in Dream Log Files. The option "Both" ist only useful for
logs that barely show any Decoded Audio. It will show the amount of
decoding of Audio that was NOT decoded.
Use this option with care. For good logs this function has no meaning. - New (from V15.0): Set default Plot Audio
In case the checkbox "Always Plot Audio Thin" is checked, the Audio will be plotted with the thinnest line option as default. - New (from V 12.0): Select how you want the DRM-Plotter to behave under "Publishing Options"
- DRM Forum and Twitter (default). The caption of the button in the Select (Main) Log is set to "Publish". When pressing the Publish button a new window opens where you can select if you want to proceed to the DRM Software Radio Forum or Twitter.- The second option is to select only to go to the DRM Software Radio Forum. The caption of the button in the Select (Main) Log is now set to "Forum".
- The third option is to select only to go to Twitter. The caption of the button in the Select (Main) Log is now set to "Tweet".
- Set your coordinates for your Receiving Location. The
default is just an example (Berne Switzerland). By pressing the button
"Change" you can enter several locations and later easily switch between
them.

- Click in the field Add Location and write your city
- Enter your Latitude in degrees and minutes
- Double-click on the "N" and change to "S" if your location is South of the Equator
- Enter your Longitude in degrees and minutes
- Double-click on the "E" and change to "W" if your location is West of Greenwich
- Click Add to save the location
- Select where you want to enter the DRM Software Radio Forums, in the Start Page (default) or in the Search page.
- Enter your time difference to UTC in hours. (Note: This feature is not in use in V 8.2)
- You can set up a Nickname or change your Nickname
- Select the Software Log Files you want to plot:
- Dream Log Files (default).
- SoDiRa Logfiles
- DRM Software Radio Logs
- Emulate DRM Calc files - You can dump the PC screen at a pre-set time. Useful if
the log is unattended. The AutoPlot function must be in use to enable
this option. Enter the time according to your local PC system clock (not
UTC!). Never mind if the DRM-Plotter covers Dream on the desktop, the
DRM-Plotter will automatically temporarily minimize itself.
- You can select a time to shut down Dream to save disk space
if the log is unattended. The AutoPlot function must be in use to
enable this option. Enter the time according to your local PC system
clock (not UTC!)
- An option to turn off the computer. This option only works
when AutoPlot in use. The computer will shut down at the time entered
in the boxes above this checkbox. This function is mainly an option for
a log during the night or if one wants to log an unattended
transmission and there is no need for the computer to be left on
running.
Keep in mind that any unsaved files and applications that are running on your computer will also be shut down without warning.
Use this function with those cautions in mind. - The RX Profiles button takes you to the Receiver Profiles.
- The "Event" button opens the "Dream Simple Scheduled Event") window. Read more here how to programme a Scheduled Event.
CREATE A RECEIVER PROFILE

Click in the field above the plotting area. The following window opens:

You may enter as many as 99 different Profiles. Your profile will show up on the main window in DRM-Plotter.
The Profiles which you already have can be edited and removed if you so wish, or you can delete the whole list.
CREATE YOUR NICKNAME

|
After you have entered a Profile, you should think of a Nickname. The
Nickname can be max. 10 characters long. You can change the Nickname
whenever you like. The Nickname is used to put a signature to your Screenshots.
The Nickname can also be accessed from |
LOADING THE NECESSARY FILES
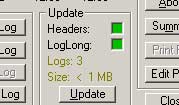 |
When you run the DRM-Log Plotter for the very first time there are no data files loaded. This is indicated by the two red fields above the "Update" command button. The programme needs two files: |
- DreamLog.txt
- DreamLogLong.csv
Doubleclick on the "DreamLog.txt" and then on the "DreamLogLong.csv" If the DreamLogLong.csv is large, it will talke a little while to load the file.
HOW TO SELECT A LOG FILE
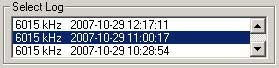
If there are more than one logfile, they will be sorted in time order, that means the latest logged transmission appears first in the window. Simply scroll down to get a previously logged transmission.
Click on the entry you want to plot. Depending on the size of the file, there will be a slight delay until the plot appears.
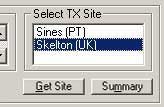
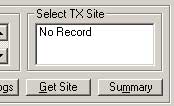
HOW TO SELECT A TRANSMITTER SITE
|
|
HOW TO SWITCH BETWEEN SHORT PATH AND LONG PATH TO THE TRANSMITTER (From Ver. 14.0)
 Short Path (Default)
|
|
 Long Path
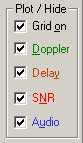
HOW TO SELECT WHAT YOU WANT TO SEE IN THE PLOT
|
|
PLOTTING AUDIO AS A SMOOTH OR A ROUGH LINE

|
|
PLOTTING AUDIO AS A THIN OR A THICK LINE

|
|
HOW TO LIMIT THE DOPPLER PLOT
|
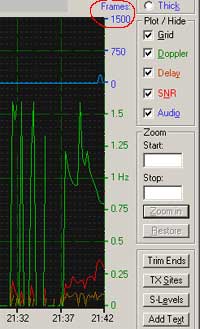
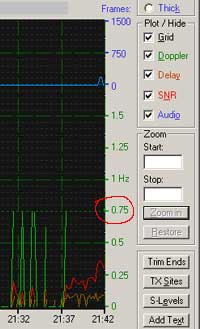
Information: In Version 15.0 and up the functions described below
are no longer present as the Doppler plot was changed from a Linear
scale to a Logarithmic scale.
If the logged transmission was unstable or had interrupts, the Doppler plot often looks messy with large swings like in the left picture. It is possible to de-select the Doppler plot, but it is also possble to limit the maximum of the Doppler curve. The maximum value can be chosen by clicking on the Doppler value, in this case 0.75 Hz in the right picture. Valid clicks are 0.25 Hz - 1.5 Hz. Press "0" in "Doppler" to restore the Doppler plot.
|
HOW TO USE THE ZOOM IN THE LOG
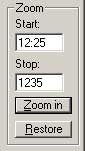
|
|
To Restore, press the "Restore" Command Button or ALT + R.
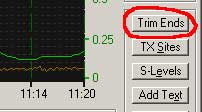
HOW TO USE THE TRIM TOOL IN THE LOG
|
|
HOW TO COMPARE THE SNR AND AUDIO FROM TWO LOGS

|
To compare two logs, first activate this function by clicking on the Compare button. Then select another log to compare with.
Note: It is not possible to compare logs if the Main Log is less than 15 minutes long. |

|
The two plots are identified by their different colours. The Doppler and Delay checkboxes are automatically deactivated to avoid too much clutter when comparing two logs. It is possible to activate these functions manually if one so wishes. |

|
By clicking in the field above the plotting area it is possible to
toggle between the Main Log and Compared Log data. The data for the
compared log is limited to Max. SNR and Decoded Audio. The Audio Plot can be suppressed by clicking on the words Audio, Main or Compare in the upper left corner of the plotting area. A warning will sound if the logs do not overlap.
|
HOW TO USE THE AUTOPLOT OPTION

|
Dream must be logging if you want to use Auto Plot . First Update the
Log Files. Then select the first log in the "Select Log" list. This
activates the Auto Plot command button. In the Autoplot window you can set the following parameters:
The caption of the Auto Plot command button changes to "Stop". To change the Auto Plot settings, click Stop, wait a second, then click Auto Plot again. The best refesh rate is two or four minutes. The larger the csv file gets, the longer it takes to prepare and perform the refresh.
NOTE FOR WINDOWS VISTA USERS:
Dump Dream Configuration: |
HOW TO CHANGE THE BACKGROUND COLOUR OF THE PLOT AREA
- Go to Set-Up
- In the frame "Plot Field Background", select Black or White
- Press OK to exit Set-Up
HOW TO PRINT A COPY OF THE PLOT AREA TO YOUR PRINTER

If you want to want to print a hard copy of the Plot on your local printer, you must first change the Background Colour of the Plot Area to white instead of the default black. To do so, go to Set-Up and switch to white background in "Plot Field Background".
Press the button "Print Plot" to proceed.
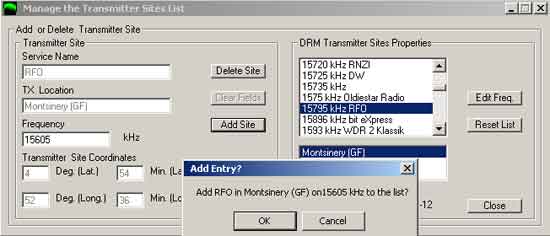
HOW TO ADD A TRANSMITTER SITE TO THE LIST

To add a New Site you must fill in the Service Name, Transmitter
Location and the Frequency before you can add the new Transmitter Site.
- Write a Service Name, i. e. "A new DRM Service"
- Write the Transmitter Site, i. e. "The Transmitter Site"
- Type the Frequency in kHz. Note: The frequency must be higher than 100 kHz
Note that if no coordinates are given the Distance to TX will be set to "0" and this field will not be active.
If you know the coordinates of the Transmitter Site, then
- Type the Latitude in Degrees and Minutes
- Type the Longitude Degrees and Minutes
- Change the fields "N" and "W" to "S" or "W" if necessary
The Command Button "Clear Fields" erases the contents in all the fields except for "N" and "E"
HOW TO VIEW DETAILS OF A TRANSMITTER SITE

To see the properties of a Transmitter Site:
- The list of frequencies appear in the window when the window opens.
Write the frequency in the Find QRG field or scroll down until you find
the frequency you are looking for and click on it.
- The corresponding TX site(s) will be shown in the field
below. If you click on a frequency in the Find QRG window, the Site will
display automatically. If you prefer to select from the list, you must
click on the site you want to see the properties for.
- The data for the Transmitter Site will be listed in the
fields to the left. If there are more DRM stations operating on one
frequency, you would see a multiple choice in the lower field. The
details will only show up if you click on the site that corresponds to
the DRM station. The Distance to the Site and the Azimuth is also shown.
HOW TO CHANGE A TRANSMITTER SITE FREQUENCY
|
|
If there is new frequency for this Transmitter Site, this option makes
possible to simply open up the TX Site and add the new frequency.
|
HOW TO DELETE A TRANSMITTER SITE

To delete a site from the list, first perform the 3 steps in How to View Details of a Transmitter Site above.

Before the entry is removed, you can decide to proceed or cancel the operation.
HOW TO UPDATE YOUR TX SITES LIST FROM THE WEB

You can update your TX Sites file from the web by pressing the "Update" button. You will be prompted to proceed or quit. If you proceed, DRM-Plotter will download the latest TX Sites file from a web server, compare it to your local TX Sites file and add the entries it could not find on your computer. The entries you might have added yourself will be left as they are. No TX Sites will be deleted.

SHOW SNR MAX, SNR MIN AND AVERAGE SNR IN THE LOG

|
To show the Max. SNR and Min. SNR in a log, click on the text to the
left of the SNR values. A dot will show the event in the SNR plot. If
you click on the text "Average", a dotted line is added to the plot. The markers for Max and Min SNR stay visible as long they are not de-activated. Click on the "Check" symbol to de-activate. The Average SNR dotted line will remain visible when a different log is loaded or if Auto Plot performs a refresh. A click on the "Check" symbol disables the dotted line.
|
SHOW THE MODE CHANGES IN A LOG

|
If you click on the frame caption "DRM Modes Used" you will get Mode
Change Labels added to the plot, provided there was a mode change during
the logged transmission. The labels are placed with their left edge at
the time of the mode change. In case the log is zoomed when Mode Change labels are present they will not be rearranged so you need to click on the frame caption "DRM Modes Used" again. To erase the Mode Change labels, click on the log file in the "Select Main Log".
|
HOW TO ADD S-METER LEVELS TO THE LOG

|
The automatic recording of Signal Levels is not implemented, but if you
take note of the Signal Levels during the logging period, you can enter
those readings manually and present it in the log as dots or as a gray
line with dots. A scale in dBµV appears in the main plotter window to
the left. The scale spans from +80 dBµV (10 mV in 50 Ohm) to -10 dBµV (0.31 µV in 50 Ohm) at the bottom. Levels exceeding +80 dBµ will be diplayed as red dots at the +80 dBµV level. The same happens for levels below -10 dBµV, which will be displayed as blu dots on the 0 dBµV level. Red or blue dots indicate that the plot is actually outside the limits of the the plotting window.
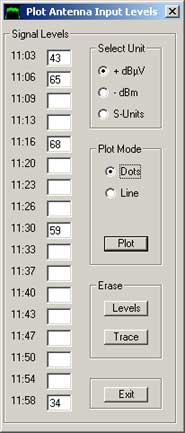
You can choose from writing the levels in
|
|
The 17 fields correspond to the Time Axis in the Plotting Field. When
you note the S-Meter levels during the logging, you will find that one
of the times in the "Plot Antenna Input Levels" will correspond to or be
near the time of your notes. Please note that the plotted curve is always displayed as dBµV in the plotted area, even if you wrote dBm or S-Levels. Each plotted dot gets a label with the calculated dBµV to the right of the dot. Input Levels as dBµV
Input Levels as -dBm
Input Levels as S-Meter readings
Notes:
|
HOW TO ADD COMMENTS TO THE LOG

|
It is possible to add up to 6 comments to the log. The text will always
be placed above the SNR curve. The comments will appear at the time
you enter in the "Time" field. The comment may be up to 32 characters
long. First write the time, then write the comment. The text will appear
in the plot as soon as you write. When you write a comment towards the end of the log, note that the text will automatically stop at the end of the plot. Long notes may collide with each other. A 7:th comment up to 90 characters long can be added to the plot. The time stamp for this comment is hidden. If you are not satisfied how the comments look, you can either clear them one by one with the button on the right to the text field, or you can erase all with the button "Clear All" Important:
|
HOW TO SAVE A LOG FILE

|

|
|
Logfiles can be saved under a file name. The logs can be saved either
as the complete log from beginning to end, or you could save a zoomed
part of the log. The saved files are saved in the directory
"C:\drmplot\logfiles\" To save a log, press the command button "Save Log" (or press ALT + V). Before the log is saved you will be asked whether you want to save this log or not. |
|
HOW TO LOOK UP A SAVED LOG FILE
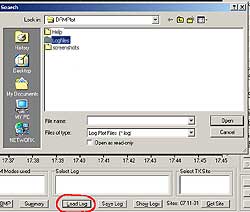
|
|
HOW TO MAKE A SCREEN SHOT OF THE LOG
 |
You can save the log as a Screen Shot. The format of the screen dump is a PNG File (*.png).
To make a Screen Shot of the Log, press the command button "Screenshot" (or press
). |
|
|
Before the Screen Shot is saved you may cancel the operation.
Note: |
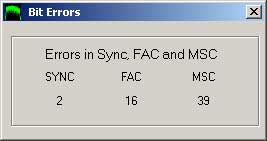
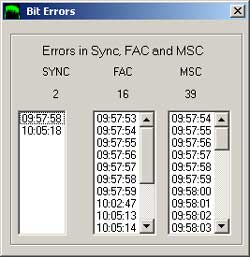
THE FAC BIT ERROR SUMMARY WINDOW
|
|
|
|
|
|
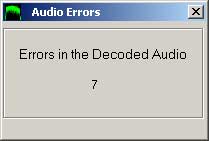
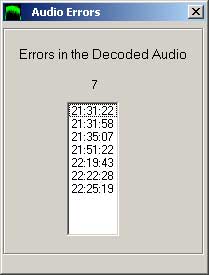
THE DECODED AUDIO ERROR SUMMARY WINDOW
|
|
|
|
|
|
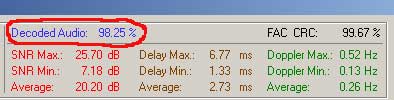
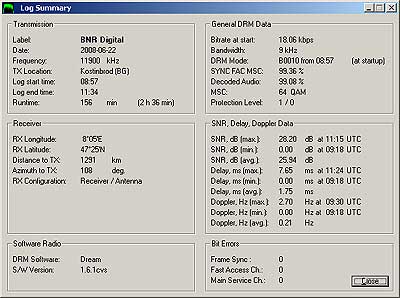
SUMMARY
|
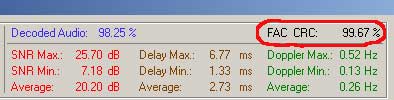
Under Summing Up you get:
|
HOW TO SET YOUR TWITTER ACCOUNT ADDRESS

|
You should enter the path to your Twitter account:
|
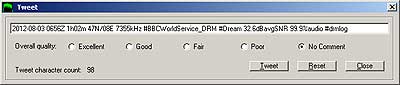
HOW TO SEND A TWEET TO YOUR TWITTER ACCOUNT

|
|
HOW TO COMPOSE AND SEND A MANUAL TWEET
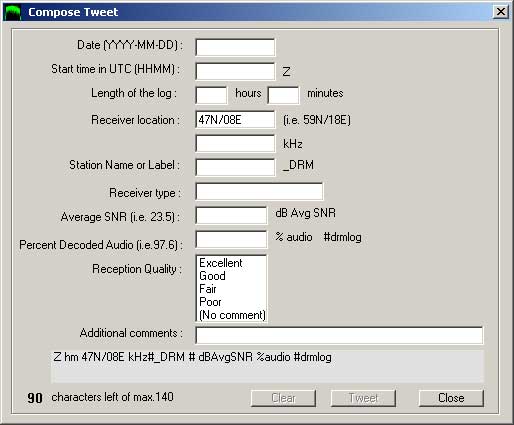
|
|
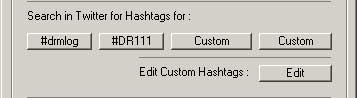
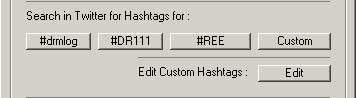
SEARCH TWITTER FOR HASHTAGS:
|
|
There are two fixed keywords in the search options, "#drmlog" and
"#DR111". You can add another six of your own. It is possible to
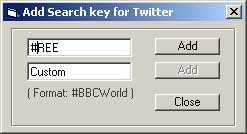
change the keywords by clicking "Edit". Click either of the buttons named "Custom" and a new form opens:
Clicking the #REE button will open Twitter and show the resuls for this Hashtag.
To delete this Hastag, click "Edit" and highlight the "#REE" and delete it, then click on "Add". The button will be renamed to "Custom". |
MAXIMUM NUMBER OF LOGS
You may log up to 300 entries in one DreamLog.txt file, but the DreamLogLong.csv will grow very large. Therefore, when the number of logs exceed 280 you will see the following warning message:
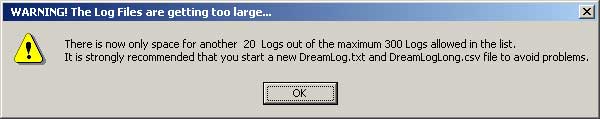
This message warns you that your files are growing too large. You can click "OK" and go on with your session, but after you finish working with DRM-Plotter you should look for the DreamLog.txt and the DreamLogLong.csv in the Directory where Dream puts these files and rename them.
A simple renaming to "DreamLogA.txt" and "DreamLogLongA.csv" lets you select them with the "Update" command button.
When you start Dream, new DreamLog.txt and DreamLogLong.csv are automatically created.
THE DRM FORUM SHORT-CUT
Use this Button to get to the DRM Software Radio Forum in www. The entry point in the DRM Software Radio Forum can either be the Start Page or the Search Forums Page depending how you selected the options in the Basic Setup Parameters.
In case the option Search Forums Page is selected then simply paste the selected Log Frequency in the Keyword(s) by pressing CTRL+V

DREAM SIMPLE SCHEDULED EVENT
This feature comes in handy if you are using an analogue receiver and want to log something when you're not home or is asleep or cannot attend the programme.
IMPORTANT: The "Set Event" button will only work after a fresh DRM-Plotter Start.
If you are already using the DRM-Plotter, close it and re-start the DRM-Plotter.

First make sure that the paths to the DreamLog.txt, DreamLogLong.csv and Dream.exe correspond to the directory on your computer. If not, change the paths and save your settings. Also check that the Dream.exe is correct, otherwise change it and if necessary add switches (if any). This information is usually needed if you installed Dream in another directory than "C:\Dream"
Follow these steps to set up a Scheduled Event:
- Tune your Receiver to the desired frequency to log
- Type the Frequency. This will be used in Dream for the Log File Frequency
- Type the Time when Dream should start logging (usually when the programme is scheduled to start)
- Type the Time when Dream should stop the log (usually at the end of the programme)
- If you decide to Auto-Plot, check the "Start Auto Plot" checkbox
- Check the "Track Mode Changes" if you'd want to use this function
- If you want to switch off your computer when the log is done, check the "Turn Off the Computer at the end of the Log"
Caution: Keep in mind that any unsaved files and applications that are running on your computer will also be shut down without warning.
Use this function with those cautions in mind. - Click "Accept" to save your settings.
Note: If you close this Scheduled Event window you will cancel your Scheduled Event!
- Dream starts and begins logging after a delay of 15 seconds. This delay allows the Label in Dream to appear in the DreamLog.txt
- The Scheduled Event window closes
- If Auto Plot was selected, the DRM-Plotter starts AutoPlotting
after a delay of 20 seconds. A refresh is done every four minutes.
- Dream will shut down at the pre-set time. If Auto Plot was selected, it will also stop.
- Finally, if the computer was scheduled to be turned off at the end of the transmission, Dream will shut down, if Auto Plot was selected, it will also stop, the DRM-Plotter is closed and the computer will be turned off.
THE DRM-PLOTTER SHORT-CUT KEYS (HOTKEYS)
| ALT + A | About this software |
| ALT + B | Opens the Basic Set-up (drmplot.ini) (V5.60 or higher) |
| ALT + C | Capture the screen as a Screenshot |
| ALT + D | Toggles the Doppler on / off |
| ALT + E | Opens the Signal Level screen |
| ALT + F | Opens the DRM Forum Home Page |
| ALT + G | Selects the TX Site |
| ALT + H | Plot Rough |
| ALT + I | Plot Audio as a Thin line |
| ALT + J |
Erase the Dream Mode Change Screendump files (V3.47 or higher) |
| ALT + K | Plot Audio as a Thick line |
| ALT + L | Get a saved Log |
| ALT + M | Opens the Summary Screen |
| ALT + N | Plot or hide the SNR |
| ALT + O | Plot or hide the Audio |
| ALT + P | Opens the Receiver Profiles screen |
| ALT + Q | |
| ALT + R | Restores the screen Full Plot after a Zoom |
| ALT + S | Opens the TX Sites screen |
| ALT + T | Plots Smooth Audio |
| ALT + U | Opens the Update Data files window |
| ALT + V | Saves the current log to a log file |
| ALT + W | Shows the Logs |
| ALT + X | Opens the Input Text window |
| ALT + Y | Toggles the Delay on / off |
| ALT + Z | Performs a Zoom |
LIMITS TO THE DRM-PLOTTER
It is recommended:
It is not possible:
|
A FINAL SUMMARY OF THE DRM-PLOTTER
DRM-Log Plotter shows:
- Decoded Audio, absolute or relative
- SNR
- Doppler
- Delay
- Decoded Audio
- SNR from a second log when using the "Compare" function
- Maximum, minimum and average SNR
- Maximum, minimum and average Delay
- Maximum, minimum and average Doppler
- Decoded Audio in percent
- Distance to the Transmitter in kilometers
- The runtime of each log
Other DRM-Log Plotter features:
- A choice of a smooth Audio Plot or a Rough Audio Plot
- A zoom function lets you study segments of the log in detail
- Shows a list of DRM Modes used during the transmission and the time of Mode change
- Select the transmitter site for a given frequency
- Shows the Bandwidth and the Bit Rate at the time of the log start
Under Profiles you can:
- Enter a Nickname for the Screenshots
- Write up to 99 different receiver and antenna configurations
- Edit a configuration entry
- Remove a configuration
- Delete the whole list of configurations
DRM Transmitter Sites:
Under DRM Transmitter Sites you can:
- List the frequencies in the data base
- Select a site or sites for a frequency
- Look up the coordinates for this site
- Add a custom site to the data base
- Delete a no longer used site from the data base
- Update the latest available TX Sites Data from the Web
Summing up Under Summing Up you get:
- All data from the log plot in plain text
Additional features:
- Save a log with Label and Site information
- Save a zoomed part of a log with Label and Site information
- Look up a saved log from your saved logs
- Save a Screen Dump of the log, which saves the form as a Bitmap File
- Send Tweets to your Twitter account
- Create Custom Tweets
- Search for DRM Logs
- Search for DR111 Logs
Download the newest version of DRM-Plot
Feel free to download the programme, the Transmitter Sites data and the readme file (a zip file) for Windows.
The software is supplied as is and IBIS (Consultants) will not be held
responsible for any loss of data or any other problems that might occur
from using this software.
The latest published version is Ver. 16.18 (Build 990.161.10). This HELP
refers to this version (except for the SNR Average function).
Comments and suggestions are welcome. The e-mail address is included in the Readme File.
The DRM-Log Plotter has been been tested with the following versions of Dream:
1.6.1cvs
1.7.9cvs
1.10.3cvs
1.10.4cvs
1.13
1.14
2.1.1-svn808
DRM-Log Plotter has been tested on the following platforms:
Windows 2000 SP4
Windows XP
Windows Vista Home Edition
Windows 7 Home Premium 64 bit
(Windows 8.1 pending April 2015)
Another version of DRM-Plotter, V 6.388s (drmlogplot975.0.210.88s.exe Special Edition) from 31st May 2010 with an automatic RX Level plotter is available upon request.
The DRM Plotter software uses the FreeImage open source image library. See http://freeimage.sourceforge.net for details. FreeImage is used under the (GNU GPL or FIPL), version (license version).
This HELP File was amended on 8th December 2015